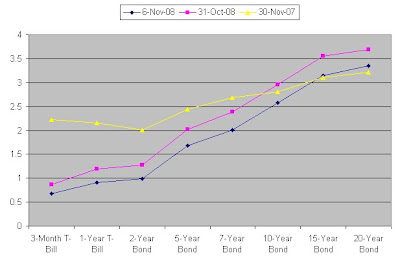
I did a calculation on the dividend yield of my stocks portfolio as I am curious how that yield fares. The yield works out to be 3.84% per annum for the period of November 2007 to October 2008. The yield is calculated based on the total dividends received as a percentage of my cumulative and monthly weighted average investment amount for the same period.
Just for the sake of comparison, I attach a chart of SGS Bonds yield curve. From the chart, you can see that only a 20 year SGS Bond can achieve close to the yield of my stocks portfolio. Of course SGS Bond is relatively safe in contrast to my stocks portfolio in which I need to take higher risks. Therefore I expect to gain on invested capital at the end of 20 year period to justify for the risk undertaken.

Because of slowdown in the global economy, I anticipate my forward dividend yield to fall. I will probably monitor the yield in future again and shall continue to add more dividend paying stocks into my portfolio if opportunity arises.
1 comment:
Managed to find the historical dividend yield of STI and the other index by sectors:
http://www.ftse.com/Indices/FTSE_ST_Index_Series/Values.jsp
Post a Comment