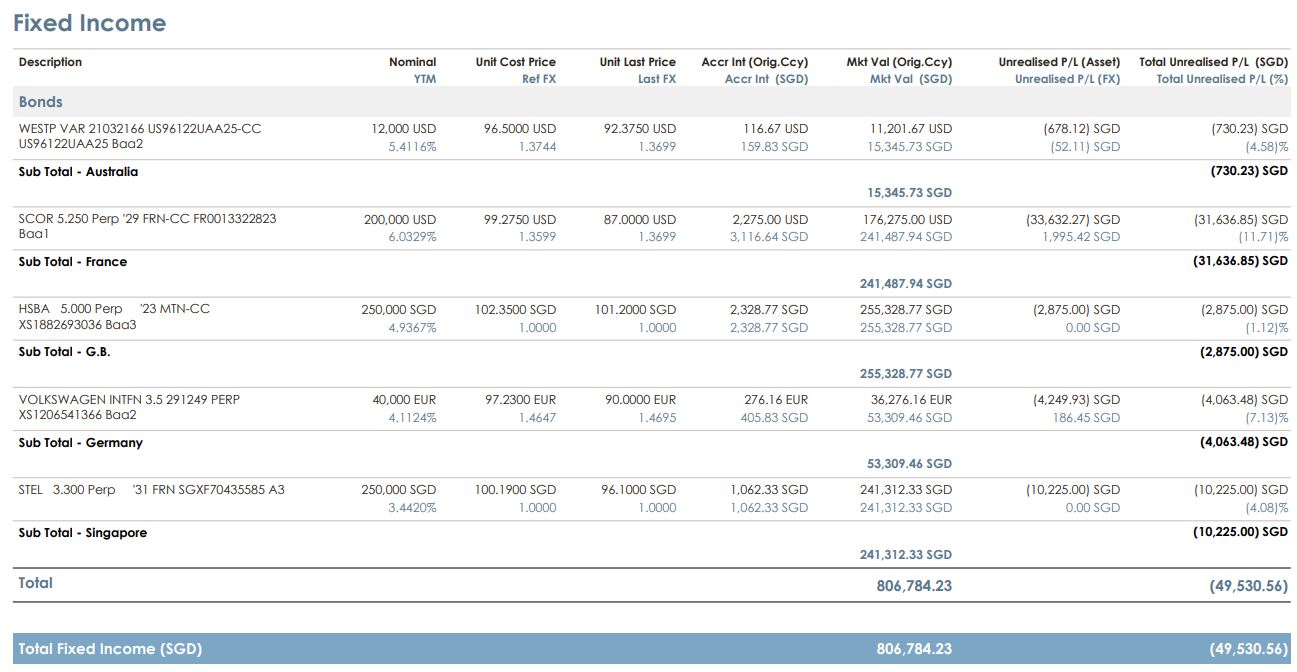
Wednesday, May 1, 2013

My stocks portfolio - Apr 2013

My holding period return was 1.95% in the month of April 2013. Since the beginning of the year 2010, my overall holding period returns translate to 12.29% in annualised return.

There were 5 transactions in the month of April 2013.
Sold Nam Cheong, at 3.55% gain (excluding dividends)
Sold partial Tat Hong, at 11.31% gain (excluding dividends)
Sold partial Tai Sin, at 12.85% gain (excluding dividends)
Sold partial Sarin, at 55.85% gain (excluding dividends)
Sold partial ARA, at 49.91% gain (excluding dividends)

Jan Feb Mar Apr May Jun Jul Aug Sep Oct Nov Dec FY
2010 -1.75% 1.36% 2.98% 4.36% -7.12% 4.40% 4.49% -1.38% 6.76% 3.09% -1.61% 3.93% 20.38%
2011 -0.03% -4.77% 2.07% 1.29% -0.32% -2.39 -0.33% -8.34% -6.53% 7.52% -7.05% 0.52% -17.85%
2012 9.41% 5.52% 2.62% -0.22% -3.13% 2.55% 2.84% 1.99% 4.27% -0.34% 0.11% 2.75% 31.67%
2013 5.18% 2.33% 3.02% 1.95%
Annualised Return = 12.29%
Stock Mode Unrealised P/L (SGD) Stock Mode Unrealised P/L (SGD)
ARA CASH 50.30% SABANA REIT CASH 41.84%
BH GLOBAL CASH -22.86% SARIN CASH 55.19%
CAPITAMALL TRUST CASH 34.54% SATS CASH 6.15%
CDL HOSPITALITY CASH 24.53% SGX CASH 11.73%
CHINA MILK * CASH -100.00% SIA ENGG CASH 37.52%
FIBRECHEM * CASH -100.00% SILVERLAKE AXIS CASH 53.29%
FAR EAST HOSPITALITY CASH 14.53% SPDR GOLD CASH -14.78%
FIRST REIT CASH 77.94% STARHILL GLOBAL CASH 9.38%
FRASERS CENTREPOINT CASH 36.52% STARHUB CASH 82.27%
FRASERS COMMERCIAL CASH 17.43% ST ENGINEERING CASH 23.98%
GMG CASH -30.99% TAI SIN CASH 9.49%
GUTHRIE CASH 67.03% TAT HONG CASH 10.85%
KEPPELCORP CASH 204.52% TECK WAH CASH 19.05%
KINGSMEN CREATIVES CASH 24.17% UOB-KAY HIAN CASH -8.22%
MAPPLETREE GCC CASH 19.64% VALUETRONICS CASH -20.20%
NOBLE GROUP CASH -23.69% BH GLOBAL CPF -47.91%
OKP CASH -13.15% CAPITAMALL TRUST CPF 20.53%
PARKWAY LIFE CASH 40.94% PARKWAY LIFE CPF 34.33%
RAFFLES MEDICAL CASH 47.04% SIA ENGG CPF 6.57%
RIVERSTONE CASH 1.71% SPDR GOLD CPF -10.84%
ROXY PACIFIC CASH 95.72%

Newbie's bond portfolio performance - Apr 2013

Presentation Style 1

Initial Capital = USD150k+SGD430k+EUR14k = USD517,428.40 equivalent (at month-end FX rates)
End 2013 January Net Portfolio Value = USD506,264.29
End 2013 February Net Portfolio Value = USD508,659.81
End 2013 March Net Portfolio Value = USD493,682.75
End 2013 April Net Portfolio Value = USD505,713.88

Year to Date Portfolio performance = -2.26%

Presentation Style 2

Initial Capital = USD521,393.82  / SGD635,773.20
End 2013 January Net Portfolio Value = USD506,264.29 / SGD626,449.03
End 2013 February Net Portfolio Value = USD508,659.81 / SGD628,810.34
End 2013 March Net Portfolio Value = USD493,682.75 / SGD612,561.56
End 2013 April Net Portfolio Value = USD505,713.88 / SGD622,786.64

Year to Date Portfolio performance = -3.01% (USD terms) / -2.04% (SGD terms)

---------------------------------------------------------------------------------------------------------

Gross coupons received in the month = USD13,457.62 (Cloverie 8.25%, CNP 7.5%, and GLP 5.5%)
Gross coupons received YTD 2013 = USD20,520.12

Projected net leveraged coupon yield = 15.99% p.a.*

Comments for the month
With the 10Y UST yield remaining significantly below 2% (UST price up) and the expectation that interest rates will continue to remain low for extended periods, coupled with no end in sight to QE, bonds have continue to maintain their upward momentum as investors hungry for yield continue to pile into fixed income as well as high yielding equities. My big bet on Unicredit 5.5% SGD continues to drag on my portfolio performance with its price in the 94 region. Although Italy had re-elected their President as well as Prime Minister, the market needs to see definitive action taken resulting in stability before we can see any significant rally in the Italian bond market. Italian sovereign bonds have rallied a bit in recent weeks but the effect has not flowed down to the Corporate Bonds. Although the price of my Unicredit bond continues to be below par, as long as I do not sell it (hold till maturity), I would not be too concerned with the price as I continue to receive the high 5.5% p.a. coupons (high for investment grade 10NC5 SGD bond) and will receive 100% back upon maturity (assuming no default).

The benefits of regular coupons being received from a fixed income portfolio can be observed from my example. Even though I am losing 6%+ on paper on my Unicredit bond purchase price, the coupons received from all my bonds as well as paper gains from my other bonds have significantly offset the Unicredit paper loss, resulting in just a 2-3% overall paper loss for my portfolio. Even if my Unicredit bond continues to remained depressed, I would expect my portfolio to breakeven soon from the continued receipts of coupons from the bonds.

Known portfolio measurement weaknesses
1. I had converted SGD500k of loans into USD @ 1.239 in order to save on loan interest costs in this new portfolio. Simultaneously, in my main portfolio, I had switched USD loans into SGD (loan interest rate arbitrage across my main and new portfolio). Although there is no Net FX exposure when I look across my main and new portfolios, I have created Net Short USD exposure in my new portfolio. Based on my estimations, every 0.01 upward movement in the USD/SGD rate will result in an artificial SGD5k loss in my new portfolio, and vice versa.
2. Bank pricing valuations for bonds, particularly SGD, may not be accurate. For instance, GLP is priced at 102.25 as at End February when traders are quoting 103.5/104.
*. I am aware that the projected net leveraged coupon yield does not factor in the losses I would suffer in the event my premium bonds are called or redeemed (conversely, gains on discount bonds are not included as well). This is just a projection of my Net Coupons received annually.


Saturday, March 30, 2013

My stocks portfolio - Mar 2013

My holding period return was 3.02% in the month of March 2013. Since the beginning of the year 2010, my overall holding period returns translate to 11.96% in annualised return.

There were 2 transactions in the month of March 2013.
Sold Lippo Malls, at 26.85% gain (excluding dividends)
Bought Mappletree Greater China Commercial Trust (IPO), average price at $0.93

Jan Feb Mar Apr May Jun Jul Aug Sep Oct Nov Dec FY
2010 -1.75% 1.36% 2.98% 4.36% -7.12% 4.40% 4.49% -1.38% 6.76% 3.09% -1.61% 3.93% 20.38%
2011 -0.03% -4.77% 2.07% 1.29% -0.32% -2.39 -0.33% -8.34% -6.53% 7.52% -7.05% 0.52% -17.85%
2012 9.41% 5.52% 2.62% -0.22% -3.13% 2.55% 2.84% 1.99% 4.27% -0.34% 0.11% 2.75% 31.67%
2013 5.18% 2.33% 3.02%
Annualised Return = 11.96%

Stock Mode Unrealised P/L (SGD) Stock Mode Unrealised P/L (SGD)
ARA CASH 52.28% ROXY PACIFIC CASH 107.24%
BH GLOBAL CASH -20.00% SABANA REIT CASH 31.45%
CAPITAMALL TRUST CASH 21.20% SARIN CASH 57.42%
CDL HOSPITALITY CASH 27.65% SATS CASH 2.44%
CHINA MILK * CASH -100.00% SGX CASH 15.01%
FIBRECHEM * CASH -100.00% SIA ENGG CASH 28.82%
FAR EAST HOSPITALITY CASH 19.09% SILVERLAKE AXIS CASH 37.09%
FIRST REIT CASH 55.00% SPDR GOLD CASH -6.31%
FRASERS CENTREPOINT CASH 29.85% STARHILL GLOBAL CASH 0.88%
FRASERS COMMERCIAL CASH 6.14% STARHUB CASH 67.63%
GMG CASH -24.99% ST ENGINEERING CASH 21.44%
GUTHRIE CASH 68.13% TAI SIN CASH 14.96%
KEPPELCORP CASH 218.45% TAT HONG CASH 13.46%
KINGSMEN CREATIVES CASH 21.44% TECK WAH CASH 25.76%
MAPPLETREE GCC CASH 11.59% UOB-KAY HIAN CASH -9.02%
NAM CHEONG CASH 7.89% VALUETRONICS CASH -20.20%
NOBLE GROUP CASH -17.58% BH GLOBAL CPF -45.98%
OKP CASH -13.15% CAPITAMALL TRUST CPF 8.58%
PARKWAY LIFE CASH 33.55% PARKWAY LIFE CPF 27.28%
RAFFLES MEDICAL CASH 41.02% SIA ENGG CPF -0.17%
RIVERSTONE CASH 7.07% SPDR GOLD CPF -1.99%

Friday, March 29, 2013

Newbie's bond portfolio performance - Mar 2013

Presentation Style 1

Initial Capital = USD150k+SGD430k+EUR14k = USD514,503.06 equivalent (at month-end FX rates)
End 2013 January Net Portfolio Value = USD506,264.29
End 2013 February Net Portfolio Value = USD508,659.81
End 2013 March Net Portfolio Value = USD493,682.75

Year to Date Portfolio performance = -4.05%

Presentation Style 2

Initial Capital = USD521,393.82  / SGD635,773.20
End 2013 January Net Portfolio Value = USD506,264.29 / SGD626,449.03
End 2013 February Net Portfolio Value = USD508,659.81 / SGD628,810.34
End 2013 March Net Portfolio Value = USD493,682.75 / SGD612,561.56

Year to Date Portfolio performance = -5.31% (USD terms) / -3.65% (SGD terms)

---------------------------------------------------------------------------------------------------------

Gross coupons received in the month = USD2,000.00 (Aviva 8.25% and Prudential 7.75%)
Gross coupons received YTD 2013 = USD7,062.50

Projected net leveraged coupon yield = 15.94% p.a.*

Comments for the month
Bond prices, particularly longer dated bonds and perpetuals have recovered from January 2013's lows as the 10 year UST yields retraced below 2% (price of UST rose). My big bet on Unicredit 5.5% SGD continues to drag on my portfolio performance with its price in the 95 region. European sentiment continues to be weak with inconclusive Italian elections proving to be a drag on both Italian Sovereign and Corporate bond prices.

Known portfolio measurement weaknesses
1. I had converted SGD500k of loans into USD @ 1.239 in order to save on loan interest costs in this new portfolio. Simultaneously, in my main portfolio, I had switched USD loans into SGD (loan interest rate arbitrage across my main and new portfolio). Although there is no Net FX exposure when I look across my main and new portfolios, I have created Net Short USD exposure in my new portfolio. Based on my estimations, every 0.01 upward movement in the USD/SGD rate will result in an artificial SGD5k loss in my new portfolio, and vice versa.
2. Bank pricing valuations for bonds, particularly SGD, may not be accurate. For instance, GLP is priced at 102.25 as at End February when traders are quoting 103.5/104.
*. I am aware that the projected net leveraged coupon yield does not factor in the losses I would suffer in the event my premium bonds are called or redeemed (conversely, gains on discount bonds are not included as well). This is just a projection of my Net Coupons received annually.


Saturday, March 2, 2013

Newbie's bond portfolio performance - Feb 2013

Presentation Style 1

Initial Capital = USD150k+SGD430k+EUR14k = USD516,075.14 equivalent (at month-end FX rates)
End 2013 January Net Portfolio Value = USD506,264.29
End 2013 February Net Portfolio Value = USD508,659.81

Year to Date Portfolio performance = -1.44%

Presentation Style 2

Initial Capital = USD521,393.82  / SGD635,773.20
End 2013 January Net Portfolio Value = USD506,264.29 / SGD626,449.03
End 2013 February Net Portfolio Value = USD508,659.81 / SGD628,810.34

Year to Date Portfolio performance = -2.44% (USD terms) / -1.10% (SGD terms)

---------------------------------------------------------------------------------------------------------

Gross coupons received in the month = NIL
Gross coupons received YTD 2013 = USD5,062.50

Projected net leveraged coupon yield = 15.94% p.a.*

Comments for the month
Bond prices, particularly longer dated bonds and perpetuals have recovered from January 2013's lows as the 10 year UST yields retraced below 2% (price of UST rose). My big bet on Unicredit 5.5% SGD continues to drag on my portfolio performance with its price in the 98 region.

Known portfolio measurement weaknesses
1. I had converted SGD500k of loans into USD @ 1.239 in order to save on loan interest costs in this new portfolio. Simultaneously, in my main portfolio, I had switched USD loans into SGD (loan interest rate arbitrage across my main and new portfolio). Although there is no Net FX exposure when I look across my main and new portfolios, I have created Net Short USD exposure in my new portfolio. Based on my estimations, every 0.01 upward movement in the USD/SGD rate will result in an artificial SGD5k loss in my new portfolio, and vice versa.
2. Bank pricing valuations for bonds, particularly SGD, may not be accurate. For instance, GLP is priced at 102.25 as at End February when traders are quoting 103.5/104.
*. I am aware that the projected net leveraged coupon yield does not factor in the losses I would suffer in the event my premium bonds are called or redeemed (conversely, gains on discount bonds are not included as well). This is just a projection of my Net Coupons received annually.

My stocks portfolio - Feb 2013

My holding period return was 2.30% in the month of February 2013. Since the beginning of the year 2010, my overall holding period returns translate to 11.24% in annualised return.

There were 5 transactions in the month of February 2013.
Sold Genting, at 10.66% gain (excluding dividends)
Sold Biosensors, at 5.37% gain (excluding dividends)
Sold partial Nam Cheong, at 0.51% loss (excluding dividends)
Bought Silverlake Axis, new average price at $0.46
Bought Starhill Global, average price at $0.88

Jan Feb Mar Apr May Jun Jul Aug Sep Oct Nov Dec FY
2010 -1.75% 1.36% 2.98% 4.36% -7.12% 4.40% 4.49% -1.38% 6.76% 3.09% -1.61% 3.93% 20.38%
2011 -0.03% -4.77% 2.07% 1.29% -0.32% -2.39 -0.33% -8.34% -6.53% 7.52% -7.05% 0.52% -17.85%
2012 9.41% 5.52% 2.62% -0.22% -3.13% 2.55% 2.84% 1.99% 4.27% -0.34% 0.11% 2.75% 31.67%
2013 5.18% 2.30%
Annualised Return = 11.24%

Stock Mode Unrealised P/L (SGD) Stock Mode Unrealised P/L (SGD)
ARA CASH 35.56% ROXY PACIFIC CASH 105.59%
BH GLOBAL CASH -14.29% SABANA REIT CASH 29.37%
CAPITAMALL TRUST CASH 24.68% SARIN CASH 54.63%
CDL HOSPITALITY CASH 28.89% SATS CASH -0.93%
CHINA MILK * CASH -100.00% SGX CASH 13.52%
FIBRECHEM * CASH -100.00% SIA ENGG CASH 33.44%
FAR EAST HOSPITALITY CASH 11.49% SILVERLAKE AXIS CASH 19.82%
FIRST REIT CASH 40.12% SPDR GOLD CASH -7.14%
FRASERS CENTREPOINT CASH 24.39% STARHILL GLOBAL CASH -0.82%
FRASERS COMMERCIAL CASH -0.63% STARHUB CASH 61.46%
GMG CASH -16.59% ST ENGINEERING CASH 19.75%
GUTHRIE CASH 71.43% TAI SIN CASH 11.31%
KEPPELCORP CASH 230.96% TAT HONG CASH 13.09%
KINGSMEN CREATIVES CASH 7.79% TECK WAH CASH 27.44%
LIPPO MALLS CASH 29.67% UOB-KAY HIAN CASH -9.82%
NAM CHEONG CASH 5.85% VALUETRONICS CASH -22.15%
NOBLE GROUP CASH -19.62% BH GLOBAL CPF -42.12%
OKP CASH -10.57% CAPITAMALL TRUST CPF 11.69%
PARKWAY LIFE CASH 27.74% PARKWAY LIFE CPF 21.75%
RAFFLES MEDICAL CASH 39.30% SIA ENGG CPF 3.41%
RIVERSTONE CASH 7.07% SPDR GOLD CPF -2.85%

Wednesday, February 6, 2013

Newbie's bond portfolio - Trade # 11

I bought another USD100k notional of Macquarie 6% USD 2020 as my eleventh trade.

At a client price of 108.386, it works out to:
YTM = 4.57%

I will be using the sale proceeds from IDG to largely fund this purchase with the remainder made up of USD loans.

Assuming this bond is fully supported by USD loans up till the approved lending ratio, the projected Net leveraged YTM is 32.15%.

Rationale for purchasing this bond can be found in my earlier trade post on Macquarie bonds.