Showing posts with label Stocks Articles. Show all posts

Sunday, June 19, 2011

Importance of rebalancing

I am sure many of us have seen our stocks turned from very positive returns to negative returns in a short period of time. During my experience, I have personally faced such encounters. Just to name a few, they are Healthway, Cosco and Capitaland. At the peak of their traded prices, my returns in these stocks have reached +66.7%, +172.3% and +80.8% returns respectively. Now they are valued at -23.1%, -41.1% and +10.5% returns respectively. My potential returns have diminished because I didn’t get to sell them earlier. Of course it is regrettable when you look back in the past or on hindsight. But how can we actually overcome this diminishing return effect in future?

One possible method I can think of is rebalancing. Investopedia explains rebalancing as

The process of realigning the weightings of one's portfolio of assets. Rebalancing involves periodically buying or selling assets in your portfolio to maintain your original desired level of asset allocation.
For my case, I don’t buy into bonds. Most of my cash are invested into stocks as I am a high risk taker. So what I can do is to switch into cash when the market is moving up or switch back into stocks when market is tanking. The most important point to take note of is that the switching should be done on a continuous basis and not at one shot. For example, when market goes up by 10%, I should be switching 10% of my stocks into cash. When market goes up by another 10%, I must switch another 10% of my stocks into cash. The reverse should be done when market tanks. The bottom line of rebalancing is, there should be some kind of system in selling your profitable investments and buying into the less performing investments. Just like for my case, the two assets are stocks and cash. So I should be switching between these two assets. The rebalancing technique I have mentioned is another method of rebalancing in my opinion. I am making use of the market return to trigger my switching decisions. Alternatively, one can also follow the investopedia definition by using weightage as a trigger in making switching decisions.

Now we know there ought to be some system of rebalancing so as to realise some profits and plough back into the less performing investments. But the question is, which are the stocks to sell when the market is going up? Here are some basic techniques in identifying the stocks to sell.

1.Sell those profitable stocks that have run up too fast within a short period of time.
2. Sell those profitable stocks that are overvalued.
3. Sell those profitable stocks that have reached your target returns.

At the moment, market is pretty volatile and uncertain because of US economic recovery, Europe debt crisis and China slowing down. For now, no one can be really sure if the market has bottomed or not. I didn’t manage to sell my profitable stocks during the recent up market but now I am adopting a slightly different rebalancing technique. That is I am slowly trying to sell my most profitable stocks as the market is tanking. In such a way, I can plough back my cash into stocks should the market undergo a 50% plunge like in the recent financial crisis. If the market moves up from here on, I will adopt the rebalancing technique that I mentioned in the earlier part of this post. Either way, I must learn to start selling my profitable stocks.

Friday, January 1, 2010

Efficient frontier of selected STI stocks

Year 2009 has just come to an end and I am sure there will be some investors who wish to try and fine tune their stocks portfolio for the fresh and coming year. I just completed my tutorials on Modern Portfolio Theory (MPT) so I thought of applying that knowledge into building a minimum variance portfolio consisting of STI stocks. Take note that this post is by no mean an inducement for you to buy such portfolios. It is just an application of a theory that you may or may not find them useful. Personally I don’t use MPT to select my stocks portfolio but I still think MPT deserves a consideration and awareness among investors. After all MPT is one of the highly acclaimed research theories in the study of Finance.

MPT states that one can achieve a minimum variance portfolio from a basket of risky assets. An asset can consist of a stock or a bond. An efficient frontier is plotted for every expected return against lowest portfolio risk (measured by standard deviation) by combining various assets. You can try to read more about this theory to understand MPT better.

Just for the sake of illustration, I try to create a portfolio of stocks consisting of the following bluechips:
Capitaland, Singtel, SIA, Singpost, SGX, Starhub, ST Engg and SIA Engg

In this illustration, I construct a portfolio of only stocks even though it is advisable to include bonds into ones portfolio in order to achieve better diversification. Based on the monthly returns data (from Jan 2005 to Dec 2009) of the above stocks, an efficient frontier is plotted on the following graph.

Efficient Frontier of Selected STI Stocks

There are a few things that one can derive from the above results. First of all, if you are expecting a return of 16% per annum from your portfolio, you should construct a portfolio consisting of 1.19% in Capitaland, 4.44% in Singpost, 19.29% in SGX, 33.42% in Starhub and 41.65% in ST Engg. Secondly you should not include stocks like Singtel, SIA and SIA Engg into your portfolio as you can see that their weightings are zero for every expected return. Of course you can still add them into your portfolio but the portfolio will not be an optimum one. The other thing is that SGX and Capitaland are the two star performers in each year in which both can give higher potential returns. However among the two stocks, SGX is much preferred in ones portfolio because of its lower risk. That is why SGX has a higher weighting than Capitaland for a portfolio with higher expected returns.

Note that the plot of efficient frontier is based on historical data so if returns change going forward, the frontier may change as well. A better plot can be achieved if you have a longer period of data. Also note that the expected returns are high and may not be realistic so a better frontier can be achieved if you add more stocks into the portfolio. Nevertheless I am just try to illustrate the MPT and if you are keen on this theory, you may try to include the other bluechips or even bonds into the computation and plot an efficient frontier for these risky assets. If you want the Excel file as a reference, you can always ask from me.

Wednesday, September 16, 2009

Riding the Genting story

You know one of the stocks that I most touted about is Genting. Ever since it was trading at 60 cents, I have been telling my friends to buy Genting. At current price, I know its nuts but I do still recommend Genting with a smaller stake though, as risk of downside is already higher.

Some fundamentalist may argue that Genting has been a loss making company for the past few years and has a weak balance sheet. I would not deny that but to me valuing Genting is more than the numbers on the financial statements. It is about its future prospects. If one believes in the success stories of the things “Made in Singapore”, Genting might potentially be a multi bagger or bare minimum able to reward satisfactory returns to patient long term investors.

So don’t rule out the possibility of a loss making company to turn around. In fact, if you compare Genting with NOL, the latter has a higher loss per share. But why is NOL trading at a higher price? Well you may say that I am not making a fair comparison with a stock of dissimilar sector.

DBS Vickers issued a report making a comparison among gaming stocks around the world. From the table, you can see that valuation of Genting is not really that demanding provided you believe in the forward looking statements. Take note DBS is one the underwriter of Genting RIGHTS issue. Even though the disclaimer mentioned that the analysis was done independently, I advice everyone should take those data with a pinch of salt.

Comparison of Genting and gaming stocks - Sep 2009
Source: DBS Vickers

With regards to the RIGHTS issue and for a company like Genting which requires a large capital expenditure to start off its Singapore operation, I do support their call in raising cash. The dilutive effect from the RIGHTS is not so significant after all. Genting plans to use some of the proceeds to reduce debt and thus lowering financing charges which is definitely desirable. I understand the misery of some long term investors who have participated three RIGHTS exercises in the past four years. If you are short of cash, I am sure you can always sell the nil-paid RIGHTS shares, get your shareholding diluted but still remain profitable.

In my opinion, having Genting as a small portion of your portfolio is not going to make any harm. I feel the odds are much better of buying Genting than punting at Singapore Pools. So should you buy due to speculation or fundamental reasons? I leave the reasons entirely up to you to decide. Let us put the fundamental or technical aspects of Genting aside. Barring any systemic stock market failure, I expect irrational exuberance to continue to drive Genting share price higher as we head towards the opening of Resort World Sentosa.

Tuesday, June 9, 2009

Myth of currency risk with ETF

Almost all of the ETF listed on SGX are denominated in USD currency. Then there are many times when investors including me in the beginning have misconceptions that our investments in ETF can be depreciative due to the perceived declining USD currency in the long term.

The above myth is definitely not true. For example, let us take a look at Lyxor China Enterprise (HSCEI) listed on SGX. This ETF actually tracks China companies that are listed on the Stock Exchange of Hong Kong. Since this ETF is tracking the HSCEI index which is denominated in Hong Kong Dollars (HKD), the base currency of this fund is also in HKD. Therefore investors holding this ETF will only be exposed to the currency fluctuations of the HKD.

The USDSGD fluctuations are redundant to an investor point of view if an investor is keeping his money in the ETF. He faces risk of USD currency if he chooses to sell his ETF in USD currency. If an investor home currency is in SGD, then the currency exposure that one has to face is the SGDHKD pair with regards to this Lyxor HSCEI.

Below is an attachment of a typical transaction involving Lyxor HSCEI. The return in SGD of this ETF for a particular period is compared against the return of HSCEI index in SGD for the same period. You can see that the returns are exactly the same even though the ETF is denominated in USD. Therefore the SGD money that you bought into Lyxor HSCEI will yield the same return if you use that money to buy into HSCEI index.

Comparison of Lyxor HSCEI and HSCEI Index

A reason as to why Lyxor chooses USD as a denominated currency for their ETF on SGX is because of the requirement set by SGX in wanting Singapore to become a regional financial hub. Lyxor is working with SGX to prepare a dual currency listing of their ETF. However there is no mentioning of the time frame as to when that will happen. When that happens, investors will suffer less exchange losses when their money is invested into local ETF.

Wednesday, May 20, 2009

S-REIT analysis - Mar 09

Today DBS Vickers research group came out with their latest analysis on our S-REIT stocks. It is encouraged that investors can make good use of these information and analysis as an aid for the selection of their preferred REIT (Real Estate Investment Trust) stock.

There are a few important factors that investors should look out for when deciding on a particular REIT. Basically the fundamental operation of a REIT is that the managers of a REIT will take loans or raise cash to buy assets, lease the assets and collect income from the assets. Then dividends are to be distributed after net of interest charges, management fees and some other fees. Therefore the most important consideration for a REIT is its debt profile. You wouldn’t want a REIT to have excessive debt as the interest charges can potentially lower dividend payout. The figure below is a debt profile summary of all the S-REIT.

S-REIT Debt Profile - Mar 09
Compiled by DBS Vickers

Gearing is a measure of how leveraged the REIT is. It is advisable to choose a REIT with satisfactory level of gearing. If you notice I use the word satisfactory instead of low as I believe, some amount of debt in any business can be made to good use. The level of gearing can be compared against other REITs in the same sector. Interest coverage ratio is an important number which measures income collected to interest charges. Ideally you want to have a high interest coverage ratio so that there is sufficient buffer should interest charges rise in the future, dividend payout will not be affected that much.

Then you might want to look at the debt maturity profile of the REIT. A good REIT should have their debt maturity dates to be equally and sufficiently spread. You wouldn’t want a REIT to have a bulk of their loans expiring in the same year.

I hope you have some ideas on what factors to look out for a REIT. Apart from the debt profile, you can also look out for dividend yield and discount of price to book value of the REIT as some of the factors in your decision making process. The table below gives a summary of comparison for S-REIT as compiled by DBS Vickers.

S-REIT Comparison - Mar 09
Compiled by DBS Vickers

Thursday, March 12, 2009

Banking Sector - 4Q2008

Recently DBS Vickers came out with a report comparing the three banks in Singapore. I find the article a good read and useful for those who wish to buy our local bank stocks. In short, it is still not a buy yet at the moment. Let me just give an extract of what can found in the long report.

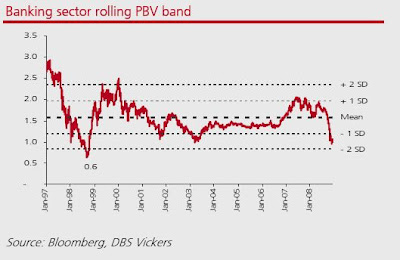
According to the report, PTB ratio of banking sector fell to a low of 0.6 back in 1999 during the Asian financial crisis. At the moment banking sector is trading at a PTB ratio of 1.0. In other words, I expect more downside pressure for banking stocks.

Rolling PTB of Banking Sector

There are some other factors which are looked at in the report. I think there are too many for me to list them out in this post, so it is best if you can get a grab of the report yourself. If you are interested to get a copy of the report, you may download it from DBS Vickers or email me so I that can send the report to you.

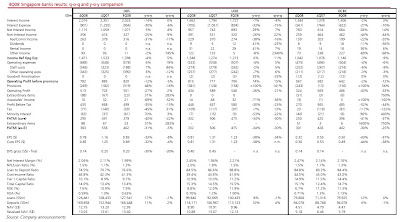
I will just post a summary of banking stocks results as of 4Q2008. I think the table can give an overall picture of the status of our banks.

4Q08 Summary of Singapore Banks Results

Balance sheet of STI stocks - 31 Dec 08 (Updated)

By now most of the bluechips have reported their earning results for end of FY2008. There were mixed earning results as some do well while others don’t.

I think we got to accept the fact that a company may remain unprofitable for a few quarters but most important question is can they survive the crisis? Some companies may take opportunities to buy assets at depressed levels during current environment. Some companies may choose to sit tight and improve their costs of operation to ride through the crisis. The bottom line is it all depends on the health of the companies’ balance sheet. A company with good cash on hands and lower debt are more likely to come out stronger than others in future.

I decided to compile a list to show the net gearing and cash & cash equivalent per share of all the STI stocks. I have intentionally left out the banks as they got a different method to calculate how well their capitalisations are. Some of the companies are not there because I can’t find their latest results yet from Reuters.

Just for your information, I have used the following formulas to calculate.
Net Gearing = (Total Debt – Cash & Cash Equivalents) / Total Equity
Net Cash & Cash Equivalent per Share = (Cash & Cash Equivalents - Total Debt) / Shares

From the list, I hope you can figure out which companies are better capitalised. For example, take a look at Genting. The company has reported successive quarters after quarters of losses. But despite of all the negative earnings, its balance sheet is still healthy afterall.

StockCurrencyC&C (M) Total Debt Total Equity Shares (M)Net GearingNet C&C per Share Ending Period
CAPITALAND SGD$4,228.40 $9,829.30 $10,681.70 3,445.230.52$(1.63)4Q2008
CAPMALL TRUST SGD$173.10 $3,202.20 $4,079.60 1,817.080.74$(1.67)4Q2008
CITY DEVELOPMENT LTDSGD$795.60 $4,146.70 $5,429.70 954.30.62$(3.51)4Q2008
COSCO CORP SGD$1,568.40 $188.80 $1,165.50 955.3-1.18$1.44 3Q2008
FRASER & NEAVE SGD$1,213.20 $5,297.90 $5,230.00 1,389.650.78$(2.94)4Q2008
GENTING INTL SGD$1,068.60 $1,405.90 $2,737.70 9,637.740.12$(0.03)4Q2008
GOLDEN AGRI - RESOURCESUSD$146.40 $553.90 $4,613.70 9,975.900.09$(0.04)4Q2008
HONGKONG LAND USD$1,119.00 $3,719.50 $11,313.30 2,276.600.23$(1.14)4Q2008
JARDINE C&C USD$843.30 $2,175.50 $2,262.70 355.70.59$(3.75)4Q2008
JARDINE MATH 400 USD$2,252.00 $3,971.00 $8,248.00 3530.21$(4.87)4Q2008
JARDINE STR 500 USD$1,896.00 $3,598.00 $9,705.00 6190.18$(2.75)4Q2008
KEPPEL CORP SGD$2,575.70 $1,970.20 $4,596.20 1,587.48-0.13$0.38 4Q2008
KEPPEL LAND SGD$626.40 $2,121.80 $2,442.60 720.880.61$(2.07)4Q2008
NOBLE GROUP USD$1,318.20 $2,556.10 $1,851.20 3,254.770.67$(0.38)4Q2008
NOL LTD USD$293.20 $1,086.40 $2,604.80 1,469.370.30$(0.54)3Q2008
OLAM INTER SGD$1,077.40 $3,493.90 $964.80 1,735.562.50$(1.39)3Q2008
SEMBCORP INDUSTRYSGD$2,400.90 $808.30 $2,594.20 1,788.80-0.61$0.89 4Q2008
SEMBCORP MARINE SGD$2,054.00 $346.00 $1,318.00 2,065.94-1.30$0.83 4Q2008
SGX SGD$625.30 $18.10 $660.90 1,071.41-0.92$0.57 4Q2008
SIA ENGINEERINGSGD$270.00 $0.80 $1,131.10 1,078.00-0.24$0.25 4Q2008
SIA LTD SGD$5,578.60 $1,656.70 $14,532.20 1,194.83-0.27$3.28 4Q2008
SPHSGD$978.80 $743.80 $2,050.60 1,460.14-0.11$0.16 4Q2008
SINGTELSGD$1,233.10 $8,253.90 $19,161.00 15,951.400.37$(0.44)4Q2008
ST ENGINEERINGSGD$819.50 $904.90 $1,580.40 3,058.540.05$(0.03)4Q2008
STARHUB SGD$126.90 $913.70 $102.60 1,718.617.67$(0.46)4Q2008
WILMAR INTL USD$3,747.80 $5,573.20 $9,606.50 6,385.680.19$(0.29)4Q2008
YANLORD LAND SGD$384.00 $1,500.30 $1,869.30 1,956.150.60$(0.57)4Q2008

Tuesday, February 3, 2009

How stock market index is created

I came across a Business Times article If Dow at 8,000 is artificial, where does this leave the STI? The author explains why 8000 seems to be a resilient number. It is because of the fact that the index is spoilt by a few stocks that are not supposed to be there. You can read more about the article from the link.

In this post, I am going to share how a market index can be created. The two commonly ways in which an index can be represented are by capitalization weighted and price weighted calculation of the index stocks. Let us use a fictitious index consisting of just three stocks.

CompanyPrice Outstanding SharesMarket CapitalizationWeightage of stock in cap weighted indexWeightage of stock in price weighted index
ABC$2 2,000,000$4,000,000 25.0%20.0%
DEF$4 1,000,000$4,000,000 25.0%40.0%
XYZ$4 2,000,000$8,000,000 50.0%40.0%

Calculating price weighted index
The summation of price for all the stocks is obtained and then divided by a divisor to obtain the final index value. The divisor is just an arbitrary number that is first defined when the index was created.

Summation of price = $2 + $4 + $4 = $10

Assuming the index is to begin from 1000, a divisor of $0.01 is to be selected in this case.

Calculating capitalization weighted index
The summation of market capitalization for all the stocks is obtained and then divided by a divisor to obtain the final index value. The market capitalization of each stock can be calculated by multiplying the price of each stock with the total number of outstanding shares. The divisor is just an arbitrary number that is first defined when the index was created.

Summation of market capitalization = $4,000,000 + $4,000,000 + $8,000,000 = $16,000,000

Assuming the index is to begin from 1000, a divisor of $16,000 is to be selected in this case.

Effect of price on indices
Now assuming that the price of company DEF increases by 50% to $6, the weightage in the index will be adjusted as follows:

CompanyPrice Outstanding SharesMarket CapitalizationWeightage of stock in cap weighted indexWeightage of stock in price weighted index
ABC$2 2,000,000$4,000,000 22.2%16.7%
DEF$6 1,000,000$6,000,000 33.3%50.0%
XYZ$4 2,000,000$8,000,000 44.4%33.3%

New price weighted index = ($2 + $6 + $4) / $0.01 = 1,200
New capitalization weighted index = ($4,000,000 + $6,000,000 + $8,000,000) / $16,000 = 1,125

From the table you can see that in a price weighted index, price has a big effect on the outcome of the new index. Even though company DEF is smaller than company XYZ in terms of capitalization, it has the highest weightage in the index when computed based on price.

I hope now you have some idea on how the market indices are computed. Just to name some, the Dow Jones and Nikkei 225 are examples of price weighted indices while S&P 500, FTSE 100 and Nasdaq are examples of market capitalization weighted indices.

Thursday, January 8, 2009

Singapore market is cheap

After my last update on STI a few weeks back, Singapore market has rebounded from its bottom to a new 2-month high of 1959.5 on the 7 Jan 2009. From the valuation ratios that I have calculated, PE ratio of STI was at 6.57 and PTB ratio of STI was at 1.27.

In my opinion, our Singapore market is still cheap. Take note the earnings used by me were the trailing 12-months (TTM). How about the earnings going forward? Of course when future earnings are expected to decline, the PE ratio is not going to stay at the same low level. But you can do some extrapolation based on the TTM PE ratio.

The table below will give an idea of what STI PE ratio is going to be if earnings are to drop by so much and assuming price remains the same level. Now you can make a smart estimate of what our forward STI PE ratio is going to be.

Taking a worst case scenario of 30% decline in earnings, our PE ratio will be 9.39 which is still more than 60% discount of a 10-year average PE ratio according to Macquarie (read comments).

TTM PE ratio (6 Jan 2009)Earnings drop byPE ratio
6.5710.00%7.30
20.00%8.21
30.00%9.39
40.00%10.95
50.00%13.14
60.00%16.43
70.00%21.90
80.00%32.85
90.00%65.70

Sample W-8BEN form

If you intend to buy stocks in the US, you will need to fill up the W-8BEN form. I got a problem filling up that form the first time. I have put up a sample form showing the important sections that you need to fill in. Just follow the sample and mail it. That is all.

sample W-8BEN form

Wednesday, January 7, 2009

SATS acquisition of SFI

Yesterday I received a circular from SATS regarding its acquisition of SFI. I can see that the management is quite concerned on the outcome of the resolution as many of the minority shareholders tend to disagree with the move. As such, I see the circular is more biased into garnering more votes to agree on the resolution. Before I highlight some of the negative points of the acquisition, let me post some of the merits out of the acquisition.

I agree with the vision of the directors to make SATS not only a world class food services group targeted to the aviation sector but also a group targeted to the non-aviation sector as well. By tapping into the catering industry like what SFI is doing locally and globally will thus reduce SATS dependency on its aviation related business operations. With the acquisition, both companies can centralize production activities and eliminate duplicate food production sites. It can also eliminate the “middleman” procurement costs with stronger bargaining power due to combined purchasing volume. All these synergies can bring about more cost savings annually and thus boosting income.

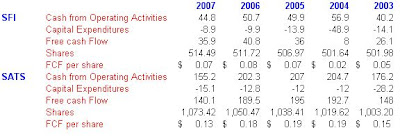
On top of the merits mentioned in the circular, let me touch a little bit on the cash generation portion of these two companies. I have presented the historical Free Cash Flow (FCF) of each company in the table below. As you can see, in future SATS may look forward to benefit from the additional FCF generated by SFI amid at an unstable rate. Only with a good FCF generation, business can move forward and shareholders can be rewarded.

SATS and SFI historical FCF

Those are some of the merits that were highlighted in the circular. I think the negative parts of the acquisition are not well brought up. First of all, as a result of the acquisition SATS will move into a slight net debt position from a strong net cash position. I feel at a recessionary times like now, SATS shouldn’t exhaust all of its 600 over million of cash in hands. In my opinion, t is prudent to keep at least a third of the money and use the remaining cash for any acquisition.

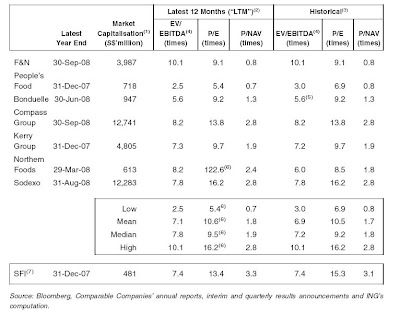
On top of that, the offer price of $0.93 is overpriced as discussed by some shareholders. Based on the last transacted price prior to the announcement, $0.93 is at a premium of 25%. It may seem fair based on the EV/EBITDA valuation and the comparison of take-over premium of selected companies in the past. But how does the valuation fair in terms of simple PE and PTB multiples?

Valuation ratios of food related companies

If you see the table above and based on PE and PTB ratios, SFI is already trading at a premium compared to its peers.

I still have some time to decide on the resolution and I will probably do so by the end of this week. Most likely I will go against it due to the negative points that I have mentioned above together with the negative outlook of SFI operations in UK which I have not looked into yet. The price may be justifiable during good times but at times like now, companies need to exercise extra caution while spending especially when all cash in hands are at stake.

Thursday, December 18, 2008

STI update - 18 Dec 08

If you have not noticed it from the chart, our STI seems to have bottomed on the 28 Oct 2008. From that day onwards, STI has been on an uptrend as shown by the positive line on the price chart. RSI and MACD are also showing positive divergence suggesting an uptrend. Furthermore STI is currently above its 25 days Moving Average (MA). The next resistance is probably at 1933 level which is the high on the 5 Nov.

STI chart - 18 Dec 08

Now why do I say that STI may have bottomed? The reason is because history may serve us as a very good lesson to understand the future. FSM has provided a historical figures of STI bear markets. I will just reproduce the table below.

Historical STI bear markets
Source: Fundsupermart

Assuming a high of 3906.96 on the 10 Oct 2007 and a low of 1473.77 on the 28 Oct 2008, that means STI had fallen by 62.28% from the peak which is on par with the Asian Financial crisis period. And assuming that Asia has truly come out stronger from that financial crisis, I believe STI should not fall worse than 62% during the current crisis. So I would say the risk of STI falling further is limited but the reward of STI going higher is definitely more appealing.

FED fund rate is already at the lowest level signaling that the major economy of the world is serious about growth in the country. We cannot expect the recovery of global economy to take place in an instant but if you are a long term investor, this is again a good opportunity to accumulate more battered stocks. As for me, I have already put in a bigger investment amount than previous months in December alone. I shall update my transactions as usual in my monthly stocks portfolio.

Thursday, December 11, 2008

Bearish outlook for SPH - 11 Dec 08

I have been keeping track of SPH for sometime. I know there are many people who bought SPH just because of the fat dividends payout recently. I believe that was part of the reason why SPH manage to hold strong compared to the other major stocks. It only fell by 22% compared to STI which fell by 53% on the 3 Dec 2008.

I hope those people who solely bought for the dividends manage to cash out and take profit early on their short term trade. From the chart, it does not look pretty good for SPH. I have attached a chart of SPH below.

Technical analysis of SPH - 11 Dec 08

MACD line has cut the signal line from the top at a very steep angle coupled with a very strong volume shown in red arrow. It suggests more downside for SPH. The first support may be $3.14 which was the low on the 28 Oct 2008. The next support could probably be the oversold level on the RSI(14) indicator as shown in red circle. So I believe it is prudent to hold your purchase if you are planning to buy SPH.

Monday, November 10, 2008

Global banks by market capitalization

Prior to one year ago we used to hear that Citigroup is the biggest bank in the world by market capitalization. But now, you will know how nasty this financial crisis can cripple even the biggest banks. No one would even expect how a world class and top bank like Citigroup and even our very own DBS took centre stage in this entire financial apocalypse.

Guess who is the biggest bank by market capitalization currently? It is no surprise how a conservative bank like HSBC can emerge at top spot suddenly. You can take a look at the following bank bubble chart. A very innovative and interesting representation I must say.

Global banks by market capitalization

Wednesday, October 22, 2008

Phillip Share Builders Plan (PSBP)

Finally I decided to sign up with Phillip Share Builders Plan (PSBP) after giving much thought. At first I disagree with such plan as I found it too costly. In fact, it may actually be more cost effective depending on the amount of investment that you set aside every month.

Fees for Phillip Share Builders Plan

The picture above shows the cost structure of PSBP as taken from Phillip Capital website. The important costs that you need to take note of are the handling fees and dividend charges. The corporate charges can be ignored, as they are rarely carried out. Then the other charges can be avoided totally. You can request for an electronic statement to save on the hard copy statement fees.

The reason why I said it could be cost effective is because you are charged only on the handling fees when buying any number of counters. Unlike buying of normal shares, you will be charged a fee on every buy for every counter. Through PSBP and assuming if you do Dollar Cost Average (DCA) into SGX and DBS counters with $5000 every month, you will only be charged at 0.2% of the investment amount rather than a separate commission for every purchases. Of course the plan may get more expensive if the investment amount gets smaller. Then unit share market may be more suitable for smaller investment amount.

Cost is not the main reason why I choose to sign up with PSBP. I have always wanted to keep shares of Singapore bluechips ever since I started investing. At that time I did not buy, as most of them require big amount of capital to begin with. Looking at hindsight I am glad I did not buy, as valuations were high also.

Now prices of bluechips have fallen significantly and are trading at cheaper valuations compared previously. Neither do I wish to wait for prices to reach unrealistic levels nor do I want to miss the opportunity of getting bluechip shares after market starts to recover again. Therefore I decided to pick SGX, Keppel Corp and Capitaland with a monthly investment amount and DCA into them. Furthermore I believe the market will remain volatile for the next few months. With a monthly DCA, I just want to get an average share price of these counters.

The other advantage of the plan is the option to reinvest the dividends received. Reinvestment of dividends may not be practical or cheap if I choose to do if myself. Through PSBP, I can choose to reinvest the dividends automatically with just a small fee. In this way, I can grow my number of shares at a much faster rate.

The disadvantage of this plan is that I will end up with odd number of shares at the end of my DCA period. I don’t think that will be a problem as I don’t intend to sell them so soon. Also I may need to pay double administrative fees of $10.70 to Phillip Capital and CDP if I choose to transfer every counter to my own CDP GSA. Alternatively I can call my trading representative from Phillip Capital to sell them away directly.

In conclusion, PSBP is a good plan for long term investors who wish to do regular savings with a selection of bluechip stocks. In my opinion, there is no other better time to start DCA other than uncertain times like now.

Friday, October 3, 2008

Stocks Beta coefficient

There are a few strategies adopted by traders or long term investors especially during time of uncertainties like now. The traders would like to ride the volatility on some stocks to make short term profit while the buy and hold investors may prefer to pick some defensive stocks.

But how can we really identify which stock is volatile or which stock is defensive in nature? One of the ways is to look at the Beta coefficient of the stocks. Beta coefficient is a measure of the volatility or systematic risk of a stock in comparison to the market as a whole. It is the reflection of the stock returns in response to the market or the changes in the index.

In short, a stock with Beta coefficient of 1 means the stock returns is the same as the market returns. A higher Beta means the stock is more volatile than the market while a lower Beta means the stock does not react too much on every market changes.

I did a list of 80 stocks which are constituents of ST and ST Mid cap index in ranking of their Beta coefficients. You may ignore those that have coefficient of 0 which is meaningless. Now you know why some people say SMRT, M1 or SPH are defensive in nature. There is no surprise also why the higher Beta stocks are most of the time listed under top volume of the day.

StockBetaStockBeta
CHINA HONGXING 2.879 VENTURE 1.153
YANLORD LAND 2.553 SUNTEC REIT 1.143
CHINA SKY 2.545 WHEELOCK PROP 1.136
STX PAN OCEAN 2.224 CAPCOM TRUST 1.129
KEPPEL TELECOM 2.212 HYFLUX 1.123
WILMAR INTL 2.181 HONGKONG LAND 1.120
GOLDEN AGRI 2.132 GUOCOLAND 1.093
SWIBER HOLDINGS 2.118 UOL LTD 1.093
SYNEAR FOOD 2.076 ASCEN REIT 1.083
EZRA HLDGS 2.012 CAPMALL TRUST 1.055
COSCO CORP 1.982 HAW PAR CORP 1.041
DELONG HOLDINGS 1.935 PARKWAY HLDGS LT 1.040
CHINA AVIATN OIL 1.866 PACIFIC CENTURY 1.012
PEOPLE'S FOOD 1.836 SIA ENGR 0.997
BANYAN TREE 1.800 STATS CHIPPAC 0.936
CAPITALAND 1.658 DBS GRP HLDGS 0.921
HOTEL PROPERTIES 1.633 UOB LTD 0.905
NOBLE GROUP 1.618 MACQUARIE PRIME 0.843
KEPPEL LAND 1.581 HONG LEONG FIN 0.836
NOL LTD 1.575 JARDINE STR 500 0.824
STRAITS ASIA RES 1.571 SAT SERVICES 0.803
WING TAI HLDGS 1.511 OCBC 0.800
CDL HOSPITALITY 1.499 SIA LTD 0.757
CHINA FISHERY 1.498 JAYA HOLD LTD 0.751
SGX 1.446 JARDINE C&C 0.749
SEMBCORP INDUST 1.437 MAPLETREE TRUST 0.739
RAFFLES EDU 1.404 SPORE TELECOM 0.732
CHART SEMICON 1.379 ST ENGRG 0.623
ALLGREEN PROP 1.361 JARDINE MATH 400 0.606
GALLANT VENTURE 1.358 COMFORTDELGRO 0.528
KEPPEL CORP 1.355 CEREBOS PACIFIC 0.391
OLAM INTER 1.317 SINGAPORE POST 0.357
GENTING INTL 1.313 STARHUB 0.318
CITY DEVT LTD 1.306 SPORE PRESS HLDG 0.266
SEMBCORP MARINE 1.225 MOBILE ONE 0.212
SPORE LAND 1.219 SMRT CORP 0.206
MACQUARIE INF 1.210 FIRST RESOURCES 0.000
SPORE PETRO-SPC 1.195 INDOFOOD AGRI 0.000
FRASER & NEAVE 1.190 LI HENG CHEMICAL 0.000
MANDARIN ORI 1.175 YANGZIJIANG 0.000

Tuesday, July 15, 2008

My bear market strategies

I believe everyone already knows the US market has entered into bear territory recently. As an investor, what should your next course of action be? First of all let me quote an excerpt from the book of Intelligent Investor by Benjamin Graham.

“…for anyone who will be investing for years to come, falling stock prices are good news, not bad, since they enable you to buy more for less money. The longer and further stocks fall, and the more steadily you keep buying as they drop, the more money you will make in the end – if you remain steadfast until the end. Instead of fearing a bear market, you should embrace it.”

I would like to share the strategies that I intend to adopt during the next few months. Please bear in mind that I am taking a long term view of the market and thus those strategies may not fit into your short term strategies.

Stick to my portfolio
I am sure many of the investors who jumped into the market last year must be in deep losses just like I am in right now. I admitted that I am not intelligent and experience enough at that time, buying into companies with high valuations and have little margins of safety.

Currently my overall stocks portfolio is probably down by 25% but I do not have the slightest intention to liquidate all of them. That is definitely the worst decision to make in this kind of situation. As long I am holding a diversified basket of stocks, I believe the portfolio should recover when the market turns positive again.

Hold my purchases
The month of July and August will be crucial reporting months for some of the listed companies. I shall wait for my vested companies to report their quarterly earnings before deciding to take further action like whether to average down or not.

A fundamentally stable company should be able to withstand the 2nd quarter slowdown. If it can generate positive earnings or at least not exhibiting a drastic negative change in earnings, then it is a good sign for me to buy more provided its valuation is still attractive.

Spread my purchases
I doubt anyone can accurately time the bottom of a bear market. So as to eliminate the risk of buying at the wrong time, it is wiser to spread my purchases into smaller ones at different periods. Just like what I did in the past few months, I shall continuously and diligently invest a portion of my income into stocks every month.

Overweight on oil and energy related stocks
We heard the price of crude oil going into record highs almost each day. Therefore I will remain overweight on oil and energy related stocks but of course not to be excessively exposed to the same sector. I am eagerly waiting for the quarterly reports of Rotary, KS Energy and Swiber before deciding to top up more.

Conclusion
As the market is cyclical in nature consisting of shorter periods of bear market and longer periods of bull market, I believe my patience to remain invested at all times can pay off when the market sentiment turns positive. In the mean time, I am looking forward to collect more dividends.

Friday, May 30, 2008

Review on China Hongxing - Part 2

In my previous article on China Hongxing, there is a point raised by La Papillion. He recommended me to include Points of Sales (POS) in the analysis of retail business like China Hongxing.

Basically POS means physical locations at which products are sold to customers. Therefore if you were to factor revenue, net income and expenses by POS, you can deduce whether an expansion or increase in the number of shops is justifiable. In other words, it also measures business efficiency in selling products through retail outlets.

Since China Hongxing is listed from 2005, I decided to tabulate data of revenue per POS, net income per POS and Selling General Admin (SGA) expenses per POS for year 2005 to 2007. A few points can be deduced from the table.

Year2005200620072005/2006 Change2006/2007 Change
Revenue (RMB’ million)$302.4 $1,411.7 $2,046.2 366.83%44.95%
Net Income (RMB’ million)$45.9 $214.6 $416.5 367.54%94.08%
Points of sales21062600320023.46%23.08%
Revenue per POS (RMB’ million)$0.144 $0.543 $0.639 278.13%17.77%
Net Income per POS (RMB’ million)$0.022 $0.083 $0.130 278.71%57.69%
SGA expenses (RMB’ million)$51.0$278.3$372.5445.69%33.85%
SGA expenses per POS (RMB’ million)$0.024 $0.107 $0.116 342.01%8.75%

Firstly, there is evidence that an increased in POS resulted in increase of revenue per POS and net income per POS. However there seems to be saturation in the increase of net income per POS from 2006 to 2007. POS grew by about 23% in both 2005 to 2006 and 2006 to 2007 but net income per POS growth was slower in 2006 to 2007 than in 2005 to 2006.

In my opinion, SGA expenses per POS should remain unchanged or slightly increased even though you increase in the number of POS. China Hongxing SGA expenses per POS did not exhibit this characteristic as the value grew 342.01% and 8.75% in 2005 to 2006 and 2006 to 2007 respectively. On the positive side, business efficiency seems to improve for 2006 to 2007 as the change was only 8.75%.

Due to a short listing span of China Hongxing in SGX, there isn’t a concrete conclusion to arrive at for this company based on the POS analysis. In a general conclusion, I would say the management has done a good job in reducing SGA expenses as evident from the paragraph above and in the first part of the review where the company manages to achieve higher net profit margin year after year.

Actually it will be good if you can see a comparison of the net income per POS against the other competitors of China Hongxing which are Li-Ning and Anta. I did not manage to include them in this article. However I have attached a table of POS analysis for Hongguo, Prime Success and Belle which are Chinese companies listed in SGX and HK markets. They are not direct competitors but they are in the same retail industry like China Hongxing. If you are interested you may visit La Papilliion article on Hongguo.

POS analysis for Hongguo, Prime Success and Belle
Table courtesy of La Papillion

Wednesday, May 28, 2008

Brief review on China Hongxing

China Hongxing share price has been sold down lately. Let me do a short fundamental and technical analysis on this stock.

Fundamental Analysis
The business of this company is very simple to understand as it is engaged in the design, manufacture and sale of sports shoes, sports apparel and sports accessories in China.

Many people are blinded to the fact that China Hongxing will benefit only from the Beijing Olympics. It is not true as there are other major sporting events coming up in China like the 2010 Asian Games in Guangzhou. Also China Hongxing has so much to benefit from its country fast growing population and with a population rich in talented sporting individuals.

Even though still profitable, their first quarter financial result was less impressive and that could be a reason why this stock is sold down. Nevertheless the result shows significant increase from the same quarter in the previous year. Turnover and gross profit increased by 43.7% and 34.9% respectively. Year on year, turnover and gross profit increased by 44.9% and 61.6%.

Pre-tax profit margin is considered good comparing with world’s top sporting brand like Nike which has a pre-tax profit margin of 14%. China Hongxing has a historical pre-tax profit margin of 10.5%, 14.4%, 14.9%, 17.3%, 16.7% and 22.0% for the year of 2002, 2003, 2004, 2005, 2006 and 2007 respectively. The increasing margin shows improved efficiency in carrying out their business.

RMB’ million1Q FY20081Q FY2007ChangeFY2008FY2007Change
Turnover648,563451,45043.7%2,046,1551,411,70744.9%
Gross profit257,763191,13234.9%841,701520,72861.6%
Gross margin39.70%42.30%-2.6%41.14%36.89%4.2%
Pre-tax profit120,07284,52942.0%450,080235,31691.3%
Pre-tax profit margin18.50%18.70%-0.2%22.00%16.67%5.3%
Net profit114,23178,77445.0%416,413214,63094.0%
Net profit margin17.60%17.40%0.2%20.35%15.20%5.1%

The company also has a healthy balance sheet. Its high current ratio of 15.74 and low debt to equity ratio of 0.14 ensure the company free of financial troubles.

RMB’ 0001Q FY20084Q FY2007
Non-current assets554,122554,310
Current assets3,599,8053,510,016
Total assets4,153,9274,064,326
Total equity3,651,2823,553,691
Current liabilities228,622239,341
Non-current liabilities274,023271,494
Total liabilities502,645510,635
Total equity and liabilities4,153,9274,064,326

Based on closing price of $0.61, its price to earnings (PE) and price to book (PTB) ratios are at 15.256 and 2.571 respectively. Take note the ratios are on the high side at first glance. But if you compare the current PE with its 52 weeks low and 52 weeks high (10.873 and 46.556), you can see that the PE is nearer to low level.

Technical Analysis

China Hongxing chart

From the chart with a closing price of $0.595, it is touching the lower Bollinger band. Taking a high of $0.75 on 28th Apr and a low of $0.405 on 20th Mar, the price has just broken the 38.2% Fibonacci retracement level of $0.618. The next support level could be at 50% and 61.8% Fibonacci retracement levels of $0.578 and $0.537 respectively before attempting to rebound from there.

14 days Stochastic has just entered oversold region while the 14 days RSI is yet to enter oversold region. There is no sign of reversal from MACD histogram suggesting that more downside is possible.

Conclusion
In my opinion, it is a good chance for medium to long term investors to pick up or accumulate this stock at a lower price of $0.537 to $0.618. Short term trader may want to wait for an oversold RSI signal or positive divergence in MACD histogram.

There are many positive calls from various analysts that you may be interested to read at. You can download the compilation from the link that I have attached.