I am sure you are always interested to compute the returns of your investment. However, most of the time investors compute only their absolute returns of investment. For example, if you invest $10000 and a few months later your investment became $15000, therefore your absolute returns is 50%. But aren't you interested to know your actual internal rate of return (IRR) or compounded annual growth rate (CAGR) of your short or long term investment?
Take for example the following scenario of an investment made by you:
Date, Transaction type, Amount
10 Jan 06, Buy stock X, $8000
14 Mar 06, Buy stock X, $6000
28 Aug 06, Receive dividends from stock X, $300
20 Aug 07, Receive dividends from stock X, $400
12 Feb 08, Sell stock X, $23500
Taking the dividends portion into account as well, how do you calculate the IRR or CAGR of your investment like the above example? It is not a straight forward task to calculate IRR or CAGR using calculator. Thanks to Mircosoft, we can make use of XIRR function from excel to do the computation. I will guide through with you on using this XIRR function.
Step 1: Open a new excel worksheet and change the format of column A to an accounting type with $ symbol or else the data is not valid later on
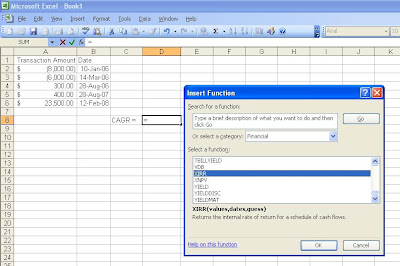
Step 2: Fill all cell values exactly as shown in the image above. A bracket denotes negative, payment or investment amount forked out. A positive value denotes amount received from investment or current invesment holding
Step 3: Select cell D8 then click fx -> select Financial in category box -> select XIRR -> click OK
If you can't find XIRR function, do the following steps:
- On the Tools menu, click Add-Ins
- In the Add-Ins available list, select the Analysis ToolPak box, and then click OK
- If necessary, follow the instructions in the setup program
Step 4: When a function arguments window pops up, type A2:A6 for Values and B2:B6 for Date. Then click OK
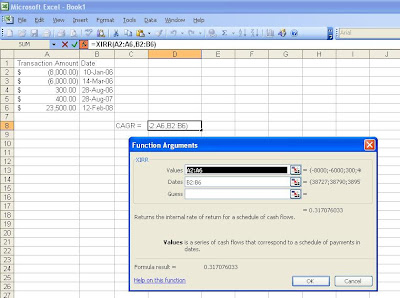
Step 5: Computed result of 0.317 will be shown on cell C8. To view the number as a percentage, click on cell D8 -> click Cells on the Format menu -> click the Number tab -> select Percentage in the Category box
The IRR or CAGR for this example turns out to be 31.7%. It is more meaningful than simply computing its absolute returns. You can also follow the same steps if you want to calculate the IRR of your expenses and incomes as long you take note of a negative sign for each cash outflows and a positive sign for each cash inflows. I hope you find this guide useful and if you think that there is any error, please do let me know.


